Instance sets A1 and A2 details
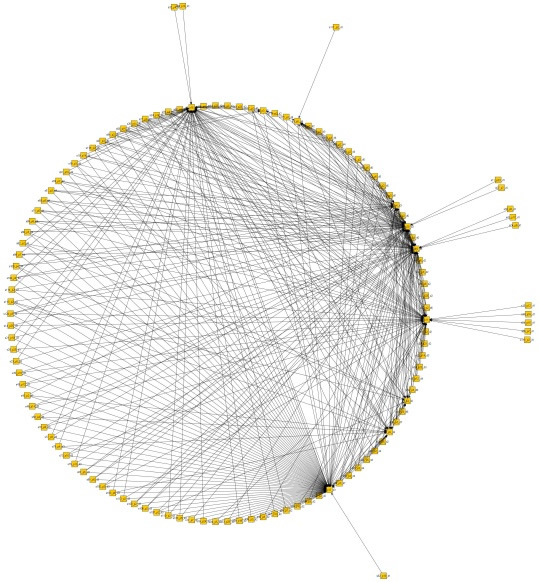
Click on the above image to see in greater detail the dependency graph between services (Dependency Constraint) for dataset model_a2_4. Each vertex is labeled S[A]_P[B]_D[C] where A=service id, B=number of processes belonging to service A and C=number of other services that service A depends on.
| model_a1_1 | P=100, M=4, R=2, S=79, L=4, N=1, BO=1, WPMC=1, WSMC=10, WMMC=100, [MIN|MAX|AVG PPS=1|4|1,27 MPL=1|1|1,00 MPN=4|4|4,00] |
|---|---|
| model_a1_2 | P=1000, M=100, R=4, S=980, L=4, N=2, BO=0, WPMC=1, WSMC=10, WMMC=100, [MIN|MAX|AVG PPS=1|4|1,02 MPL=25|25|25,00 MPN=50|50|50,00] |
| model_a1_3 | P=1000, M=100, R=3, S=216, L=25, N=5, BO=0, WPMC=1, WSMC=10, WMMC=100, [MIN|MAX|AVG PPS=1|25|4,63 MPL=4|4|4,00 MPN=20|20|20,00] |
| model_a1_4 | P=1000, M=50, R=3, S=142, L=50, N=50, BO=1, WPMC=1, WSMC=10, WMMC=100, [MIN|MAX|AVG PPS=1|50|7,04 MPL=1|1|1,00 MPN=1|1|1,00] |
| model_a1_5 | P=1000, M=12, R=4, S=981, L=4, N=2, BO=1, WPMC=1, WSMC=10, WMMC=100, [MIN|MAX|AVG PPS=1|4|1,02 MPL=3|3|3,00 MPN=6|6|6,00] |
| model_a2_1 | P=1000, M=100, R=3, S=1000, L=1, N=1, BO=0, WPMC=1, WSMC=10, WMMC=100, [MIN|MAX|AVG PPS=1|1|1,00 MPL=100|100|100,00 MPN=100|100|100,00] |
| model_a2_2 | P=1000, M=100, R=12, S=170, L=25, N=5, BO=0, WPMC=1, WSMC=10, WMMC=100, [MIN|MAX|AVG PPS=1|25|5,88 MPL=4|4|4,00 MPN=20|20|20,00] |
| model_a2_3 | P=1000, M=100, R=12, S=129, L=25, N=5, BO=0, WPMC=1, WSMC=10, WMMC=100, [MIN|MAX|AVG PPS=1|25|7,75 MPL=4|4|4,00 MPN=20|20|20,00] |
| model_a2_4 | P=1000, M=50, R=12, S=180, L=25, N=5, BO=1, WPMC=1, WSMC=10, WMMC=100, [MIN|MAX|AVG PPS=1|25|5,56 MPL=2|2|2,00 MPN=10|10|10,00] |
| model_a2_5 | P=1000, M=50, R=12, S=153, L=25, N=5, BO=0, WPMC=1, WSMC=10, WMMC=100, [MIN|MAX|AVG PPS=1|25|6,54 MPL=2|2|2,00 MPN=10|10|10,00] |
P=Number of processes
M=Number of machines
R=Number of resources
L=Number of locations
N=Number of neighborhoods
BO=Number of balance objectives
WPMC=Weight of process move cost
WSMC=Weight of service move cost
WMMC=Weight of machine move cost
PPS=Number of processes per service
MPL=Number of processes per location
MPN=Number of processes per neighborhood
Problem instances can be downloaded from the ROADEF Challenge site.
